DataScience Training
 Play Audio


|
Data Journalism and Storytelling Data Journalism The new role of data Click to read
 Numerical data are playing an increasingly important role in the production and distribution of information. Data can be used to transform something abstract into something understandable and connectable to everyone. All sectors are adapting to this transformation, including journalism: more and more news organisations (New York Times, Sky News, The Guardian...) are relying on data analysis and visualisation to produce and publish informative and engaging stories. More than half of all news organizations in the US and Europe now have at least one dedicated data journalist working in their newsrooms. For the average global citizen, more and more of our everyday lives are impacted by computers and data. In order to hold power to account, journalists should be empowered with the skills and tools to make sense of this data
Definition Click to read
Data journalism is a type of journalism in which the use of data is used to tell complex stories. It is the entire process of deriving meaning from data to develop a story - not only the visual output. A data journalist is someone who uses statistics to facilitate the writing and reporting of news stories to provide insights based on relevant data. A written story that relies on data analysis and interpretation. The key ingredient is asking questions to our data just as if we were interviewing it. Data can be the source of data journalism or the tool used to tell the story, or both. This should not be seen as replacing, but rather as complementing traditional journalism. Good data journalism helps readers understand and draw conclusions about their world. For example, it can bring scientific discoveries to the forefront of a narrative and make them accessible to readers.
The new ways of journalism Click to read
Today, news comes as it happens, from a variety of sources (eyewitnesses, blogs, etc.), so the main focus of journalists shifts from being the first to report to explaining what a certain development might actually mean. Reporters create stories using massive datasets. This reflects the growing importance of numerical data in the production and dissemination of information, the growing connection between journalists and professions like design, computer science, and statistics.
Journalists data skills Click to read
Good data-driven news’ elements Click to read
1) Good data: It is necessary to search for high quality data, ensuring that the collection methods, research subjects and any analysis are valid and free from bias. 2) Story from the data: Identify the central narrative line and make sure it is solid and consistent. 3) Storyboard and structure: For the story to be coherent and engaging, it is important to organise the content and determine which to include and which to leave out. It can be helpful to sketch out a map of the structure of the data story, as well as the data, visualisations and written content. 4) Clear narrative line: Care must be taken not to present the data as a set of numbers without sufficiently contextualising it. The role of narrative is crucial in helping the audience make sense of the information and data. 5) Interactivity: "Any sense of animation that you can bring into a piece really helps: you can have the feeling of interacting with the content." (Ronan Hughes, Output Editor of Sky News) Case study: Goalkeepers Click to read
Goalkeepers is an annual report on the progress of the 17 goals of the 2030 Agenda for Sustainable Development by Bill and Melinda Gates. See, for example, the 2019 report: "Examining equality: How geography and gender stack the deck for (or against) you". This report is an example of an excellently presented data story. The solid data and information is embedded within a story featuring a little girl living in southern Chad, a Saharan country. Seeing the child's face helps the reader to better understand what the data presented in the report represents. The narrative line is clear and coherent, the story structure is solid, and the reading is made smooth and light thanks to the visualisation techniques and interactivity of the report: moving down while reading the page, images and diagrams appear on their own, zooming in or out according to the paragraph we are reading. Data Storytelling Communicating data Click to read
Discovering key insights is one skill that requires a set of hard skills related to data analysis. Communicating these insights in a clear and compelling way requires other kinds of soft skills. Both are equally fundamental to deriving value from data. The ability to effectively communicate insights from a dataset using narratives and visualisations is called Storytelling. It can be used to contextualise data and inspire audience action From data analysis to data storytelling Click to read
The purpose of any data collection is to extract value from it. Once analysed, however, it is essential to be able to disseminate this value in order for it to be meaningful. When narrative is combined with data, it helps explain to the general public what is happening in the data and why a particular insight is important. In this sense, data storytelling is the tool that enables data analysts to translate information from the 'language of numbers' into a story and narrative that is accessible to users unfamiliar with data science.
Key elements Click to read
According to Brent Dykes, Author of Effective Data Storytelling: How to Drive Change with Data, Narrative, and Visuals—Data Storytelling is a combination of data, visuals, and narrative:
When you combine the right images and narrative with the right data, you get a data story that can influence and drive change. Data, when used and analyzed properly, can help clarify rumors and reveal facts. Here are some guidelines for inserting the key elements: Crafting effective visuals: 1. Choose the best visualization for your story: Line plot, bar pilot, scatter plot, histogram. You can obtain more information in these links: https://towardsdatascience.com/data-visualization-how-to-choose-the-right-chart-part-2-fb32ed14c7be https://www.youtube.com/watch?v=csXmVBw8cdo 2. Keep visualizations minimal and avoid clutter
Use special effects (bold, underline, italics, shadows) sparingly 3. Use text appropriately:
4. Use colors effectively: Color is one of the most powerful tools available for emphasizing different aspects of your data visualization.
You can get aditional information in these links: https://www.y42.com/blog/color-rules-data-visualization/ 5. Do not mislead with data stories:
Crafting effective narratives with data:
Considerations when crafting audience specific messaging
Data story Why is story more effective? Click to read
The brain's preference for stories over pure data stems from the fact that the brain receives a large amount of information every day and has to determine what is important to process and remember and what can be discarded.
When more brain areas are involved, the hippocampus, which stores short-term memories, is more likely to convert the experience of hearing a story into a long-term memory. The power of a story Click to read
Information obtained through data analysis, although logical and clearly reported, does not have the power to influence decisions and push the public to act. For example, business decisions are thought to be based solely on logic and reason, but neuroscientists have confirmed that emotions play a decisive role in decision-making. Narrative seems to be more effective in changing beliefs than writings specifically designed to persuade through arguments and evidence. Building a story from data insights dignifies creating a bridge from data to the emotional and influential side of the brain. People are moved by emotions, so attitudes, fears, hopes and values are strongly influenced by stories.
Key story elements Click to read
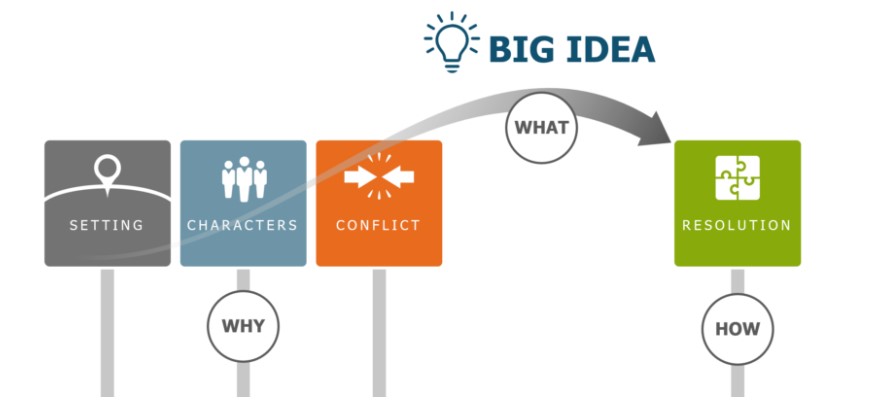
Data storytelling uses the same narrative elements as any story you’ve read or heard before: characters, setting, conflict, and resolution. The following is an example of a data story proposed by Harvard Business School. Imagine you’re a data analyst and just discovered your company’s recent decline in sales has been driven by customers of all genders between the ages of 14 and 23. You find that the drop was caused by a viral social media post highlighting your company’s negative impact on the environment, and craft a narrative using the four key story elements: ♦ Characters - The protagonists of our story are customers aged between 14 and 23, environmentally conscious consumers and your internal team. This doesn’t need to be part of your presentation, but you should define the key players for yourself beforehand. ♦ Setting - Set the scene by explaining there’s been a recent drop in sales driven by customers of all genders ages 14 to 23. Use a data visualization to show the decline across audience types and highlight the largest drop in young users. ♦ Conflict - Describe the root issue: A viral social media post highlighted your company’s negative impact on the environment and caused tens of thousands of young customers to stop using your product. Incorporate research (such as this article in the Harvard Business Review) about how consumers are more environmentally conscious than ever and how sustainably-marketed products can potentially drive more revenue than their unsustainable counterparts. Remind the team of your company’s current unsustainable manufacturing practices to clarify why customers stopped purchasing your product. Use visualizations here, too. ♦ Resolution - Propose your solution. Based on this data, you present a long-term goal to pivot to sustainable manufacturing practices. You also center marketing and public relations efforts on making this pivot visible across all audience segments. Use visualizations that show the investment required for sustainable manufacturing practices can pay off in the form of earning customers from the growing environmentally conscious market segment. If there isn’t a conflict in your data story—for instance, if the data showed your current marketing campaign was driving traffic and exceeding your goal—you can skip that element and go straight to recommending that the current course of action be maintained. Whatever story the data tells, you can communicate it effectively by formatting your narrative with these elements and walking your audience through each piece with the help of visualizations.
|


 .
.


Keywords
Data; Journalism; Storytelling; Narrative; Data Visualization
Objectives/goals:- Learn about data journalism and the skills required to be a data journalist
- Understand what is data storytelling and how to build an effective data story
- Learning how to exploit narrative techniques to disseminate insights from data
This course presents the concepts of data journalism and data storytelling. These concepts are described and explained in relation to the world of data. It is explained how to merge data science, a field of study characterised by hard skills, with soft skills and what the advantages of this combination are.
https://insightsoftware.com/encyclopedia/data-journalism/
https://www.analyticsvidhya.com/blog/2022/01/what-is-data-journalism-all-about/
https://shorthand.com/the-craft/how-to-create-great-data-journalism/index.html
https://www.forbes.com/sites/brentdykes/2016/03/31/data-storytelling-the-essential-data-science-skill-everyone-needs/?sh=3823af6152ad
https://www.nugit.co/what-is-data-storytelling/
Green, M. C. & Brock, T. C. (2000). The Role of Transportation in the Persuasiveness of Public Narrative. Journal of Personality and Social Psychology. 79, 701-721.
Heath, C. & Heath, Dan. (2007). Made to Stick: Why Some Ideas Survive and Others Die. New York: Random House.
Guber, P. (2011). Tell to Win: Connect, Persuade, and Triumph with the Hidden Power of Story. Sidney: Currency.
Related training material