DataScience Training


Data visualization - dashboards
Feedback form    |       Play Audio    |   Download:    |   


Data visualization - dashboard

Introduction

Defining a dashboard Click to read  

What is a dashboard?

Dashboards have become standard tools used in business over the last 10 years

A dashboard represents a visualization of the most important information needed to achieve one or more objectives; information must be systematized and arranged on a single screen so that it can be monitored at a glance

(Stephen Few, Information Dashboard Design, 2006)

Data tells you what is happening, but a story told with the help of a dashboard tells you why it matters, why that data is important.

The purpose and objectives of creating a dashboard Click to read  

Defining the purpose of a dashboard

The starting point in creating a dashboard is defining its purpose and the objectives it will achieve.

The key questions to ask before creating a dashboard are:

  What is the audience?

  What added value will the dashboard have?

  What type of dashboard is needed / will I realize?

  Who ? What ? Why ?  How will the data be used to achieve the objective?


What added value will the dashboard bring?

Dashboards can serve many purposes. Before creating a dashboard, the reasons for creating the dashboard must be clearly considered:

ü  Helping management define what is important
ü  Educating people in the company about the important things
ü  Setting goals for specific employees / groups of employees
ü  Encouraging specific actions in a timely manner
ü  Highlighting issues and setting alerts when they occur
ü  Communicating progress and what's happening in the company
ü  Providing an interface for interacting and analyzing the most important data in the business.
Knowing and addressing the audience Click to read  

Knowing and addressing your audience

Role

  What decisions need to be made?

  What questions need answers?

Workflow

  In what context will the dashboard be used?

  What information do they use on a daily basis? How much time do they have to analyze the numbers?

Comfort level with numbers and data:

    How familiar are they with using data?

    Do they have expertise in using the software? Do they enjoy analyzing numbers?

Business and data expertise

  How familiar are they with key performance indicators?

  Are they familiar with industry and company specific terminology?

Creating an effective dashboard

Types of dashboards Click to read  

What kind of dashboard will I create?

Depending on the purpose:

  General: Presenting of information at the level of the entire organization

  Specific: Focusing on a specific function, process, product, etc.

Depending on the role in the business:

  Strategic: Provides high-level, overall, long-term exposure to performance

  Operational: Provides focused, short-term and tactical exposure to performance

Depending on the time horizon:

  Historical: which analyzes the trends over time

  Snapshot: Analyzes performance only for a specific moment  in time

  Real-time: Monitors performance as it unfolds

  Predictive: Uses past performance information to predict the future.


What kind of dashboard will I create?

Depending on the level of customization:

  Universal: One version for all users

  Customizable: With features that allow users to modify the view to suit their needs

Depending on the level of detail:

  Overall: Only high-level key figures are presented

  Drill-down: Allows the user to drill down into the data to get a broader context.

Depending on the point of view:

  Descriptive: The dashboard tells the user explicitly how to interpret the data

  Explorer: Interpretation of results is up to the user

The structure of a dashboard Click to read  

The structure of a dashboard

The content of a dashboard should be organized in such a way that it reflects the nature of the information and helps effective monitoring.
Information cannot be placed anywhere in the dashboard, nor can sections of the view be placed just to fill the available space.
Elements that are related to each other should be positioned close to each other.
Important elements should be larger, more easily visible than less important elements.
Objects to be analyzed in a certain order should be arranged in such a way that the sequence is visually suggested.

(Stephen Few, "Pervasive Hurdles to Effective Dashboard Design", Visual Business Intelligence Newsletter, 2007)

Finding the right dashboard structure is one of the biggest challenges in building it.
The structure of the dashboard is also an opportunity to define the best way to look at the problem or the business.
The way in which the information is placed in the dashboard also determines the way in which the audience understands the transmitted message. In other words, for the user, the structure has a guiding role in navigating the dashboard.
A suitable structure for a dashboard requires a very good understanding of how the measured system (the business) works.
Depending on the structure, we can have three types of dashboards: flow, relational, grouping.
 

A dashboard with a flow-based (flow) structure emphasizes the sequence of events or actions over time.

Examples:

  Steps in the process of providing customer support

  Operational processes

  Sales process (From leads through sales channels).

A dashboard with a relationship-based structure highlights the links between entities or certain measures.

These relationships can be mathematical, geographical, organizational or functional.

The dashboard in the accompanying example exposes the relationships between financial indicators so that users can understand the factors that influence net income.

The structure of a grouping dashboard involves grouping related information into categories or hierarchies.

Placing similar elements together can create logic and accessibility to a dashboard that might otherwise seem cluttered.


Principles of design and functionality of a dashboard Click to read  

Design principles of a dashboard

It is advisable that the dashboard design should focus on only a few design principles that will be followed

A. Compact design / Modular design

The compact nature of a dashboard means that the visualization can be comprehended by the human brain

Some dashboards become too large and difficult to follow in an effort to include as much information as possible

Dashboards can be divided into smaller pieces, each of which answers a question.

B. Gradual Disclosure of Information.

Information is disclosed as the user expresses interest.

The user is not overwhelmed from the start with all the information

Increasing the level of detail is generally done from:

  Key indicators à

  The context of the indicators à

  Details on indicators


Design principles of a dashboard

C. Guidance of attention

Using visual cues and functionality to direct the user's attention to the most important things

Among the mechanisms that can be used are: alerts, positioning on the page, careful use of color and fonts.

D. Support for ease of use

Avoiding overloading the view, minimizing the number of actions for each task so that new users are encouraged to use the view

Providing clear and concise descriptions of what the items on the dashboard mean.

E. The possibility of personalization

Ensuring the flexibility to make the dashboard relevant to different users.

It is generally done by using filters

F. Explanations Before Information

Where context and explanations are needed to understand new and unfamiliar events

Sometimes leaving the interpretation of data up to the user can lead to wrong conclusions and confusion.


Elements that ensure the functionality of a dashboard
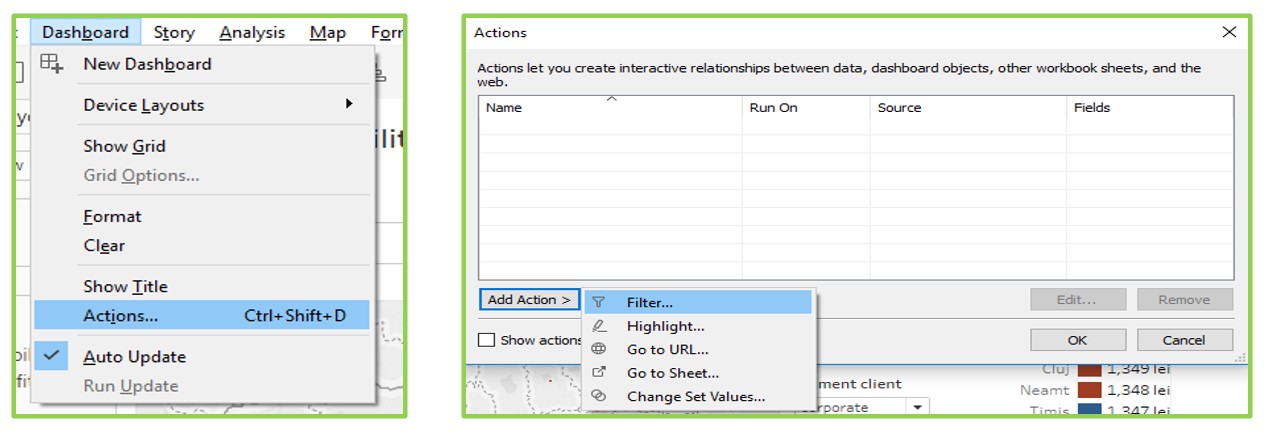
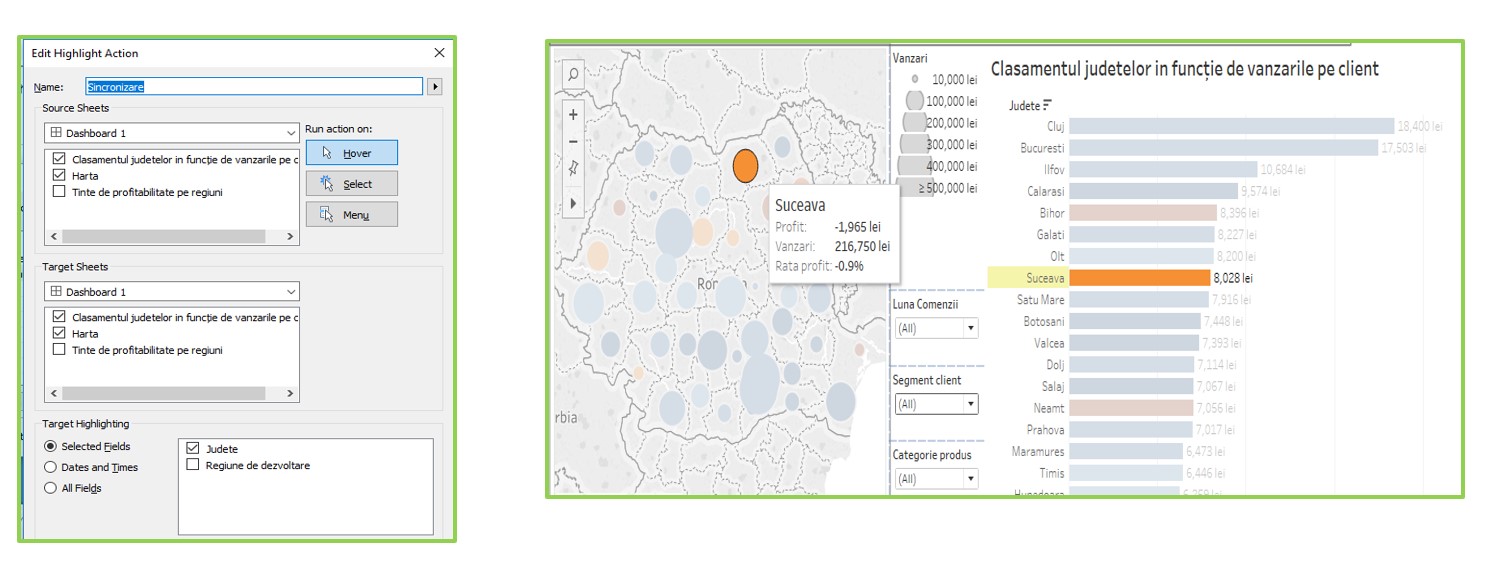
Ability to detail

  The ability to move from a summary indicator or representation to indicators that provide more detail, more context on the information
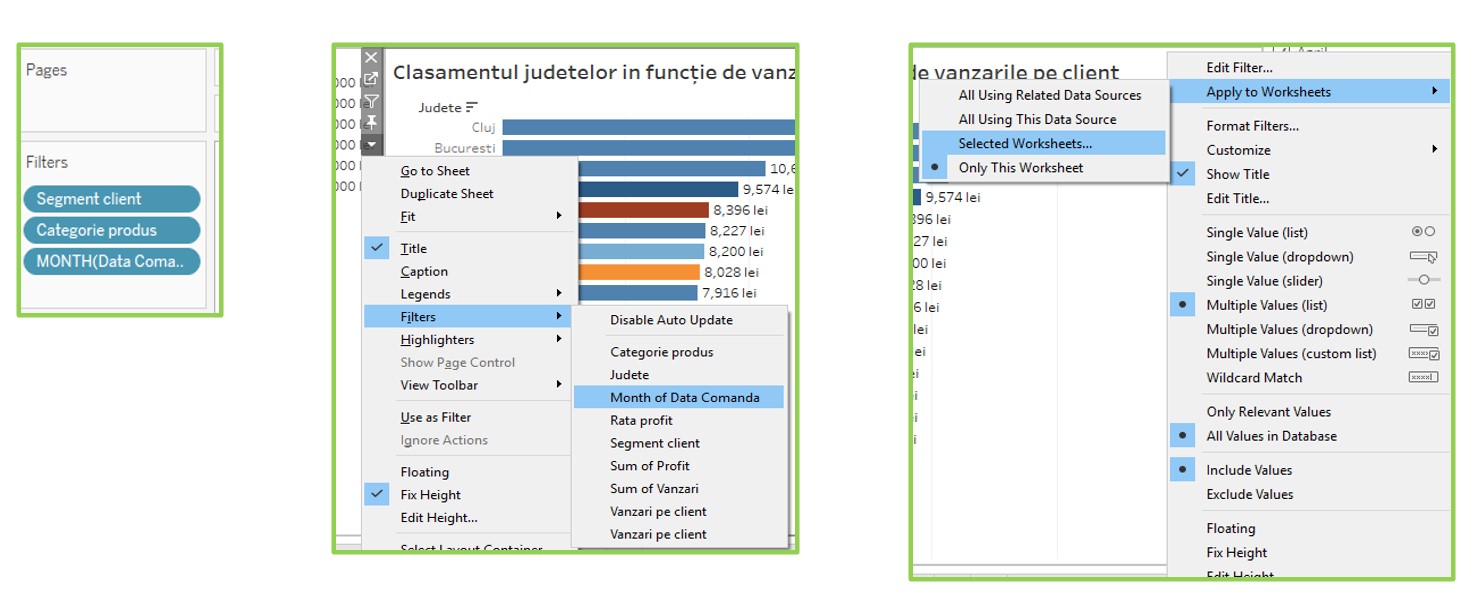
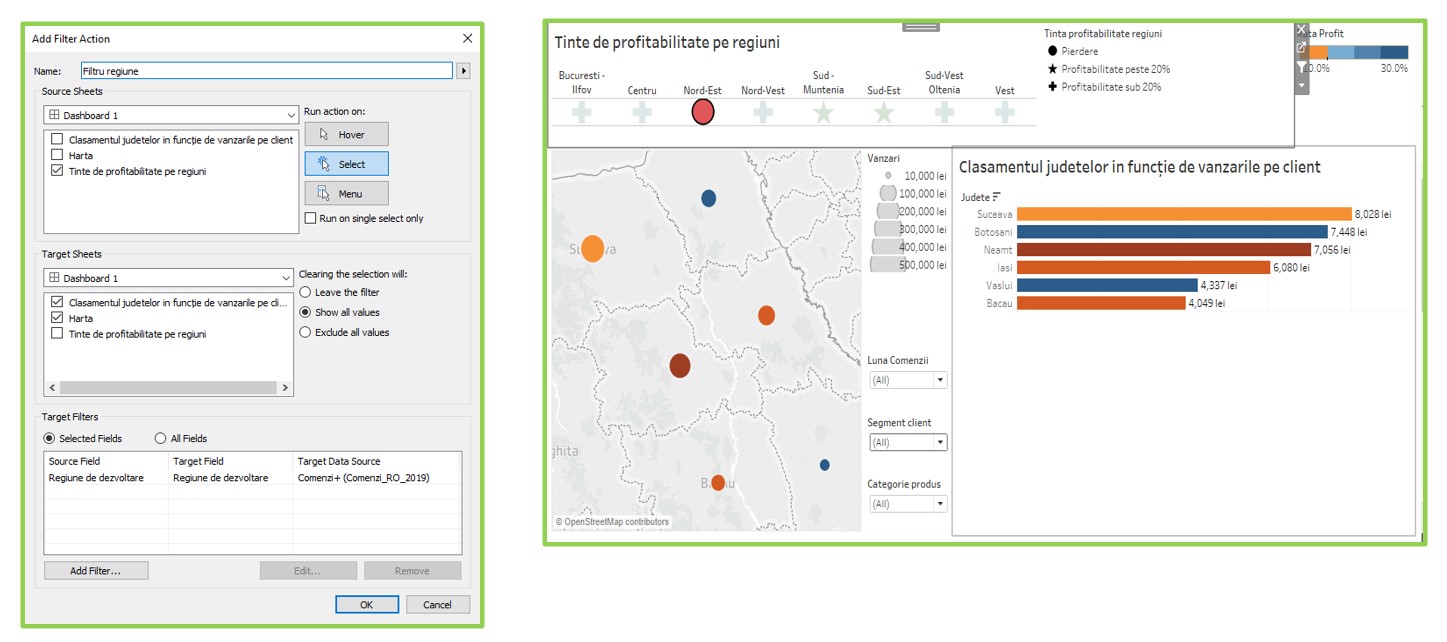
Filters

  It allows users to define what is displayed in the dashboard according to their needs and interests.

  Filters can be global (applicable to the entire dashboard) or local (specific to a chart)

Ensuring comparisons

  The ability to view two or more sets of data side by side

Alerts

  Highlight information based on predefined criteria.

  For example, an alert can be triggered if an indicator exceeds a certain threshold value.


Mistakes to avoid when creating a dashboard

Starting with a far too complex dashboard (more prototyping, testing and tweaking is recommended).
Using indicators that no one understands.
Cluttering the dashboard with unimportant graphics and stylized elements that are difficult to interpret. The dashboard must remain simple (not simplistic!) and visually appealing
Underestimating the time and resources needed to create the dashboard
Lack of synchronization between included indicators and objectives.
Use of ineffective graphics that have an uninspired design (3D, strong colors, pie charts with many categories).
Sending fake messages with the dashboard. You need to make sure that the graphics don't send the wrong message that can be perpetuated
Creating a false narrative based on the dashboard, creating false scenarios for users based on a misinterpretation of the data.
 

The best practices in creating a dashboard

1. Including the right indicators in the dashboard

Including the right indicators in the dashboard is essential

Indicators must be essential and relevant to the goals of the dashboard and to the context

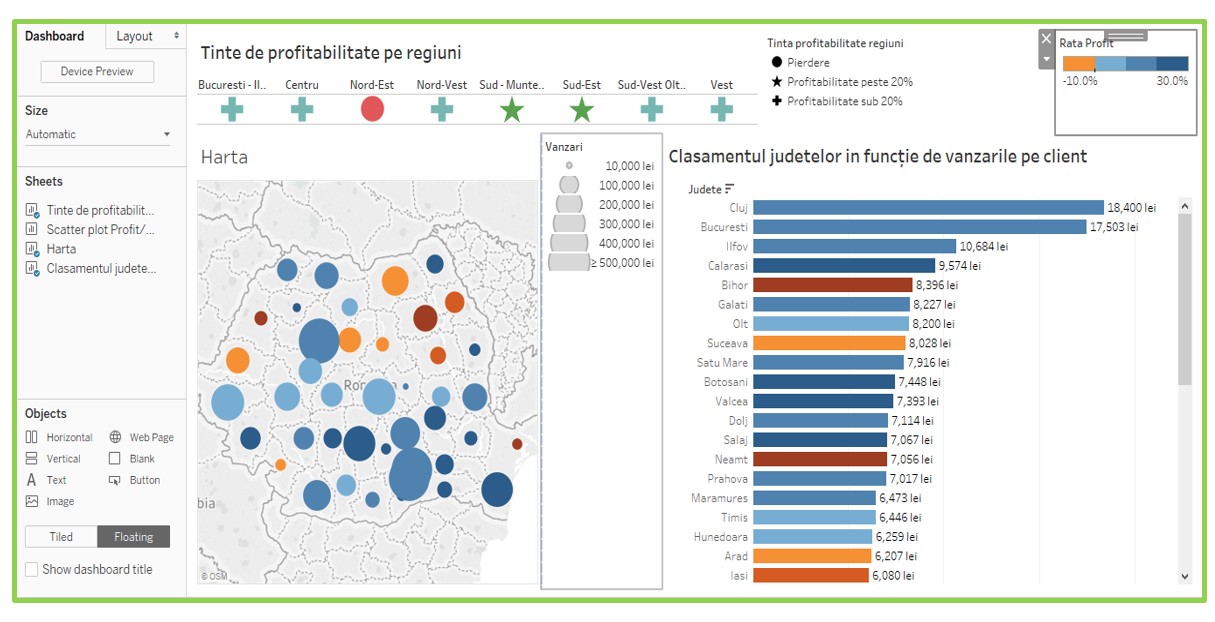
2. Inclusion of visual elements

Dashboards must be easy to read and quick to interpret

The inclusion of tables with a lot of information will be avoided, as it makes it difficult to get the message across

Elements of visual perception will be used such as: shapes, colors, lines, shades of colors, etc.

Avoid: 3D graphics, graphics that are not commonly used, overly stylized elements.

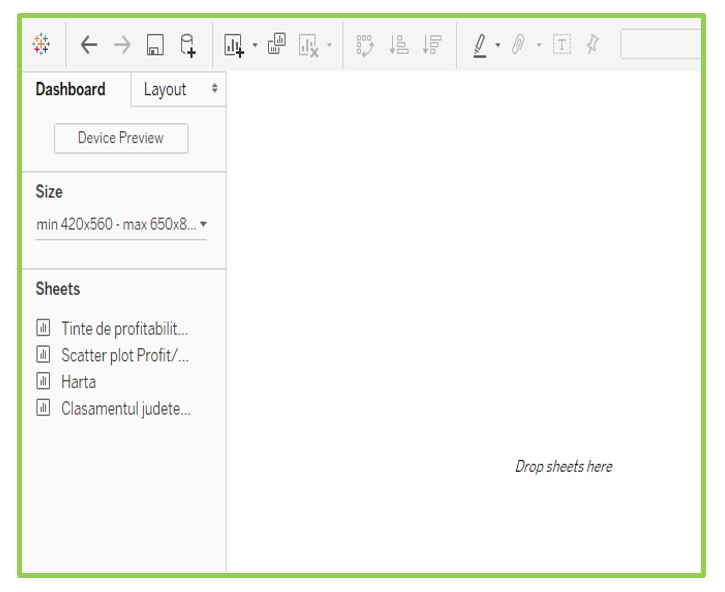
3. Inclusion of interactive elements

Dashboards need to be interactive, meaning users need to customize them to get the information they need. Interactive dashboards that contain many visual elements should allow the audience to perform basic analytical tasks, such as: filtering elements, drilling down information, or examining the data behind the graphs. Interactivity should be easily achieved with a minimum of training.

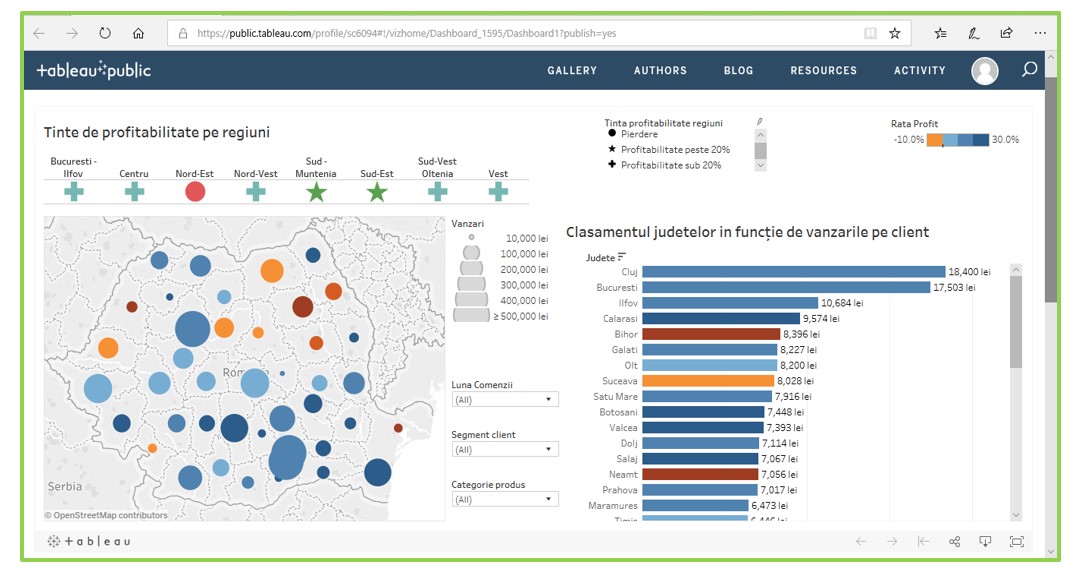
4. Keeping dashboard information current

5. The dashboard must be easy to access and use
Case Study

Defining the problem Click to read  

Context

The company's management is interested in monitoring sales realized by county, as well as highlighting the counties and product categories with a low profit rate, and what is the monthly dinamics of sales and profit rate in 2018. At the county level, the interest is on counties that have registered loss, those with profitability up to 10%, between 10% and 20% and over 20%.

At the level of development regions, the profit rate must be above 20% for the regional coordination team to meet the profitability target. Of particular interest are the loss-making regions.

The management also wants to know which counties record the highest sales reported per customer (top / ranking), with the possibility of viewing by customer segments and product categories.

Indicators to be included

To create a dashboard that meets the needs of the audience, we will need to include the following indicators:

Total sales by county

Profit rate by counties / product categories / monthly

Profit rate at the level of regions (highlighting those with a profit rate above 20% and with a negative profit rate).

Sales by customer / customer segment / product category. (ranking counties)

The proposed structure of the dashboard

Based on the indicators and the level of detail required, we opt for the following component charts:

Scatter plot to highlight the relationship between profit and sales by county

Map showing profit rate by county (color) and sales (bubble chart overlay)

Bar chart with sales per customer (ranking)

Table showing whether profitability targets were met by region.

Required filters: Time – months (depending on the order date), Customer segment, Product category

Type of dashboard: General, Customizable by the user (using filters), Detailed, Explorer

Creating a dashboard for the Orders database Click to read  

Creating a dashboard for the Orders database

a) Table showing whether the profitability targets by region have been met.

b) Scatter plot to highlight the relationship between profit and sales by county

c) Map highlithing the profit rate by county (color) and sales (bubble chart overlay)

d) Bar chart with sales per customer (ranking)


Ensuring dashboard interactivity in Tableau Click to read  

Building the dashboard


Using interactive elements – adding filters and actions to the dashboard

Adding actions to the dashboard

Actions are about correlating different information in the dashboard. For example, suppose we notice that a region is not meeting its profitability target. Then, it would be interesting that when selecting a region (from the graph located at the top of the dashboard), we limit the information from the other two representations to that region.

This can be done through an Action

Objectives/goals:

- Defining the objectives of the dashboard Role, audience


- Choosing the right indicators to be included in the dashboard


- Choosing the graphics so that they meet the objectives as well as possible


- Creating graphics and arranging them in the dashboard


- Providing interactivity elements (filters, actions)


- Ensuring compliance with design principles and good practices


Description:

This course presents the concepts of dashboard, the structure of a dashboard , the purpose and objectives of making a dashboardsection, as well as types of a dashboard.  

The last part of the module will be dedicated to a case study.


Related training material

Partners

Università del Salento
Demostene Centro Studi
IHF
IWS
Universidad de Oviedo
ASE
WAI