|
Data Science & Social Impact: Achieving Positive Outcomes
Introduction
Why should you learn this Click to read 
Data science and AI have a huge variety of applications with positive social impact. For example, data science is useful to investigate how social media impacts human rights. On the other hand, data science and AI applications also carry risks to health, safety, the environment and human rights. Bias and discrimination, privacy concerns, and harmful environmental impacts are just some of the possible effects.
In order to ensure that data science applications benefit people and the planet, it is necessary to understand both its capabilities and its risks. In this course, you will be introduced to both, and will also be introduced to some methods for addressing the risks.
Using data science for social good
Overview of possible data science for good use cases Click to read
Looking at different use cases, especially the „Amnesty Italy Use Case“, you will get an overview of how data science can be used for good purposes.
The best way to understand the positive impact data science can have on people and the planet, is to look at some examples from the recent past.
The rapid pace of technological change is also triggering changes in the labor market – old jobs and professions are disappearing, and being replaced by new ones. This has the effect of causing unemployment in some sectors, while in others, employers are hard-put to find qualified employees. But in fact, many skills obtained in the “disappearing” sectors could be readily adapted and re-used in new sectors. In the pilot project SkillsFuture Singapore, data science is used to detect such “reusable” skills, and help the unemployed with targeted trainings to re-align their skill-set with the needs in the expanding industry sectors.
AI can also be used to enhance the predictive capacity of digital twins, for instance to help make the supply chain more resilient. Digital twins use the data available to a company – whether data generated internally through operational, transactional or other processes, or publicly available data like weather monitoring – to simulate the supply chain. AI systems trained with reinforcement learning can be added to these digital twins, allowing companies to explore the effects of several 'what-if' scenarios, such as the impact of a tornado, and develop measures for reacting to such scenarios [2].
AI systems can be used in a variety of ways to work towards achieving climate goals. For instance, Fero Labs uses AI to help steel manufacturers reduce the use of mined ingredients by up to 34%, preventing an estimated 450,000 tons of CO2 emissions per year, while the Mapping the Andean Amazon Project uses AI to monitor deforestation via satellite imagery to help uncover illegal deforestation and support policy responses [3].
One of the challenges associated with electric vehicles is that they require access to electrical infrastructure specifically designed for them – namely, power charging stations. If a lot of cars need the same infrastructure at the same time, this can pose a significant challenge for the electricity grid. Taking the idea further – one of the obstacles to large scale adoption of renewable energy sources is the large fluctuation in energy availability, and limited capacity to store electricity at peak availability times, in order to then dispense it at peak usage times. Vehicle to grid technologies, which allow electric cars to be used as “storage” for surplus energy, and for the grid to draw energy from the cars when the cars are not in use, can help mitigate the problem. Using AI, Caltech developed an adaptive charging system which schedules when to charge which vehicle, and when and how much energy may be draw back into the grid, based on the departure times submitted by the driver. This lowers the overall stress placed on the electricity grid, and opens the interesting possibility for electric cars to actually relieve some of the burden on electric grids [4].
Supply chains are incredibly complex, which is a challenge for legislation such as the USA's Uyghur Forced Labor Prevention Act that aims to enforce higher social or environmental standards in products. The Altana Atlas combines geolocated information on company locations and facilities with corporate ownership data to map out trade relations across sectors. This helps companies comply with such legislation more effectively and take action on their own against problems like forced labour [5].
Wind turbines are an important source of renewable energy, yet their output depends on a factor which is difficult to control: the wind. This poses a challenge to the energy grid but also to the sales department of wind energy providers, as energy which is more predictable can also achieve higher prices. To support the business case of wind farms, DeepMind developed a neural network trained on weather forecasts and historical operational data which can predict the output of the wind farm 36 hours in advance, thus achieving 20% higher value for the energy produced [6].
Amnesty Italy Use Case Click to read
Social media is an important part of the public sphere. To investigate how political discourse on issues related to human rights is developing and how this impacts disadvantaged groups, Anmesty International Italy conducts monitoring called Hate Barometer (Barometre dell'Odio) every year using data science techniques.
The data is gathered via Facebook and Twitter public APIs, from a list of public accounts and profiles provided by Amnesty. Usually, the monitoring period encompasses between four and eight weeks (2021 saw an extended monitoring period of 16 weeks). For this period, comments from the most active accounts are randomly sampled, amounting to a set of 30.000-100.000 comments, which are labelled by trained volunteers from Amnesty in regards to topic and level of offensiveness. All of the labels are cross-checked, which means every comment is labelled by two to three volunteers and any inconsistencies are resolved by Amnesty's Hate Council (Tavolo dell'Odio).
Example: European Parliamentary Elections 2019
In the period preceding the European Parliamentary Elections 2019, public profiles of 461 candidates on Twitter and Facebook in the six weeks preceding the election (15 April – 24 May 2019). In total, 27.000 posts and 4 million comments were initially collected. In a second step, the size of the dataset had to be reduced to make the dataset manageable for the volunteers based on the extent of social media activity of the profiles while ensuring the overall representation of all parties, all regions, and at least one woman and one man per party. In this way, the final dataset included social media activities related to 77 politicians: 80% of the posts were labelled by 150 Amnesty volunteers alongside a random sampling of 100 thousand comments.
The results [8] show that hate speech is not randomly distributed, it is clustered. Even though its overall prevalence on social media platforms is estimated to be about 1%, it is more likely to occur in relation to specific groups and topics, and it peaks at certain times. For instance, hate speech is more likely to occur when the discussion involves migration, Roma, religious minorities or women.
Taking a deeper look at the data, you can also observe certain patterns. Hate speech garners more hate speech, but it is also more likely to receive interactions (such as reactions, shares or comments). It can also be used to actively exclude people from social media platforms: for example, during the 2020 monitoring campaign, it was observed how two women were specifically targeted by hate speech and three were pushed off of social media platforms [9].
Data science isn’t always good
Major known examples Click to read
Unfortunately, just like any other technology, AI and data science can also be used for bad purposes, or have unintended consequences. However, in contrast to other tools, AI automates decisions for us, and therefore has an even greater potential to cause harm. Therefore, we also need to be mindful that AI and data science can have a negative impact on humans, society, and the environment.
Data science aims to help us make better decisions based on data, by making it possible to process vast amounts or very diverse types of information. As we saw earlier, data science can be used to monitor or improve processes that help to make the world a better place. However, recent history has shown us that we cannot blindly trust the outcomes of algorithms, especially when these outcomes can have a serious negative impact on our lives.
Well-known examples of such negative impacts occurred in AI applications ranging from health to labor to the environment:
-
- Hospitals in the USA are now relying on algorithms to help them assess how sick patients, in order to determine if they need in-patient or out-patient care. One study found that the assessments of a very widely-used system were skewed in a racially biased manner: Black patients were in fact sicker than White patients who had received the same risk rating. This was likely due to the fact that the algorithm used historical health costs as a proxy for health needs – however, since the US health care system has historically been plagued by unequal treatment, less money was spent to cover the health needs of Black patients. The algorithm thus wrongly concluded that they are healthier than White patients who are in fact equally sick [10].
- Amazon built an AI recruiting tool to assist the Human Resource Department in finding the right staff for technical posts, and trained it on resumes submitted to the company over the preceding ten years. However, since most of those applications came from men, Amazon soon realized its recruitment system was not rating candidates in a gender-neutral way. The AI system penalized CVs submitted by women and containing words such as “women’s”. The software had to be taken down and has thus far not been reinstated [11].
- Back in 2015, Google’s image classifier labelled a black person as “gorilla”. Google apologized but opted for a quick fix by simply censoring “gorilla”, “chimp,” “chimpanzee,” and “monkey” from searches and image tags. Six years later Facebook classified a black man in a video as primate, recommending to users to continue watching primate videos. [12]
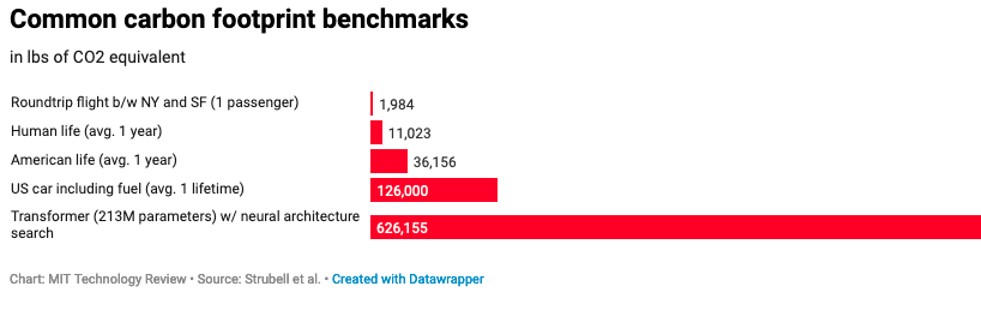
These are just some of the examples to illustrate the potentially negative impacts. Data science and AI need data - and often, this data is labelled or otherwise processed by underpaid clickworkers, working in very stressful conditions, and often also exposed to violent or disturbing content [13]. Algorithms can be used to rank employees or contractors in a manner that is discriminatory and leads to a loss of opportunity [14]. Data science and AI are computationally expensive – which means that they are also resource intensive; this is especially the case for large models and fine-tuned models like the transformers included in the comparison graph below [15].
Exercise: If you want to become a bias detective yourself, simply go to Google Translate (or deepl.com) and translate from English into German:
English: My doctor is clever. She immediately found the solution
Google Deutsch:
English: My secretary is clever. He immediately found the solution
Google Deutsch:
Google attempted to address this issue in 2018 after a big outcry about translating into stereotypical gender roles from gender neutral languages, but as you can discover for yourself, five years later, problems remain.
Overview of main risks Click to read
From using bots to create deepfake nudes on Telegram, generating sexualized avatars of women (but not men), not developing functionalities useful to a specific group of people, or undermining gender identity through binary classification, data science applications can cause harm.
One of the main risks with AI and data science is that we presume that the technology itself – like every other tool – is free of judgement and human error. However, in this theory we seem to forget that we are the ones who create these systems, who chose the algorithms, who select the data and decide on how to use and whom the system should be deployed to. Therefore, it is fundamental to understand that data science applications – even with best intentions in mind – are neither objective, nor neutral.
Reflect on what your application can do, what it is used for, who is included/excluded and who might be affected in different ways – the consequences can be widespread!
In their 2018 study [15], Joy Buolamwini and Timnit Gebru found out that gender classification algorithms using facial recognition routinely misclassify darker-skinned women more frequently than lighter-skinned men (and women). This is because the datasets which the investigated models were trained on contained a disproportionate share of images of light-skinned men and women.
Two studies from 2019 showed that algorithms used to detect offensive speech on online platforms were more likely to classify patterns of speech common amongst Black US Americans as offensive – and datasets similarly displayed widespread bias against African American English [16]. This shows how important labelling of the dataset is: if the data is labelled in a biased way, the outcomes will be biased too.
-> We need to acknowledge that data science applications are not perfect, and their errors are not randomly distributed: in fact, these systems tend to fail more often for historically marginalized or vulnerable demographic groups.
In addition, data science applications can be very data intensive, carrying with them issues of
- Privacy: AI models which rely on ever more data incentivize the collection of data in different fields. This means that a lot of data ends up being collected about people, with important implications for privacy. For instance, while it may sometimes be practical from a consumer perspective to know where exactly your parcel is at the moment, and from the perspective of a postal service provider it may be practical to have such data to optimize routes, tracking the vehicle in which a parcel is delivered also means tracking the person driving the vehicle.
- Data Protection: A lot of the data collected may allow for you to identify people and is therefore considered personally identifiable data – like the example of the parcel tracking we just discussed. Such data can not only be misused further down the line, but can also be used to restrict their opportunities, which is why the EU's General Data Protection Regulation has a strict data minimisation policy.
- Poor data quality: You might have heard of the phrase “garbage in, garbage out” in order to describe how poor data quality can lead to bad outcomes. This means that simply having a lot of data will not make your model, or your results, better. On the contrary, a large dataset which is poorly labelled, badly processed and full of irrelevant data will make your results worse. Keep in mind: most of the time spent on data science and AI projects is dedicated to creating a high-quality dataset which you can then use reliably and repeatedly. Make that effort count!
In order to counteract the risks arising from data science and AI, over 80 different ethics Guidelines have been developed to date: among the most prominent are those issued by international organizations such as the OECD, UNESCO, UNICEF; but also from big tech companies, such as Google and Microsoft.
The problem with these ethics standards is that they are neither legally binding, nor enforceable: there are no consequences for non-compliance. Ethics standards help us to set the right direction and give us guidance for what is wrong and right, however, the voluntary character of such initiatives means they are effectively a nice to have, instead of a must do.
Trustworthy AI
Trustworthy AI Click to read
In this section, we will look at the characteristics of so-called “Trustworthy AI”, analyze where the notion comes from and why this is important. We will focus on the topic of unwanted bias that can lead to discrimination and ways on how to measure fairness with the help of a confusion matrix.
The European Union has also created their own Ethics Standards, the so-called “Ethics Guidelines for Trustworthy Artificial Intelligence” [17]. A document prepared by the High-Level Expert Group on Artificial Intelligence (AI HLEG), an independent expert group that was set up by the European Commission in June 2018, as part of the EU’s AI strategy.
The EU HLEG established the following characteristics of a trustworthy AI system, based on the EU Charter of Fundamental Rights.
(1) human agency and oversight: AI systems should be understandable by humans to the extent that their decisions can be challenged, and humans should always be able to intervene in AI systems
(2) technical robustness and safety: AI systems should be able to handle a variety of situations which they might reasonably encounter, as well as malicious attacks, and they should be designed with security and safety in mind
(3) privacy and data governance: AI systems should not undermine anyone's right to privacy, data subjects should have full control over how their data is used, and the data should not be used to harm or discriminate against data subjects. In addition, an appropriate data governance system needs to be in place to ensure that the dataset is of high quality and cannot be accessed for illegitimate purposes
(4) transparency: decisions made by AI systems should be traceable and explainable to humans, and the limits of the AI system should be clearly communicated .
(5) diversity, non-discrimination and fairness: biased datasets cause problems, but also biased models or AI systems which have disproportionate effects on specific – and usually disadvantaged – groups are harmful. For this reason, diversity of representation and participation in all stages of the AI development cycle are key to identifying possible harms early on and developing appropriate prevention and mitigation mechanisms.
(6) environmental and societal well-being: AI systems have a real impact on society and on the environment, not only on individuals. This means that in some areas, the use of AI systems should be well-reflected, and all AI systems should be designed in an environmentally and socially sustainable manner.
(7) accountability: AI systems should be auditable and potential negative effects as well as trade-offs should be identified and addressed in advance, offering the possibility of effective redress if harm is caused
While the EU HLEG guide goes one step further than simple ethics guidelines, by grounding the principles in the EU Fundamental Rights Charter (a legal framework), we will see in the next section, based on the example of fairness and non-discrimination (principle 5), that there is still a long way to go from principle, to implementation.
Bias, fairness, non-discrimination Click to read
We all have a human right to be treated in a fair manner. But what is meant by fairness? Fundamentally, fairness is a subjective concept, and depends on culture and context. In an attempt to circumvent this tricky issue, much research focussed on the issue of bias in AI instead.
However, in the context of data science and machine learning in general, many different definitions of bias collide (colloquial usage vs. Statistics vs. deep learning). This is a problem because people from different disciplinary backgrounds talk about bias, but actually, they do not mean the same thing. In the context of trustworthy AI, we will take bias to be a prejudice that favors one group over another.
There are many different types of biases, such as Societal Bias, Confirmation Bias, In-group Bias, Automation Bias, Temporal Bias, Omitted Variable Bias, Sampling Bias, Representation Bias, Measurement Bias, Evaluation Bias, and many more.
All these biases - in the data, in the AI system, or arising from the interaction of prejudiced humans with the AI system - can lead to unfair treatment and discrimination, which means the unjust or prejudicial treatment of different categories of people, for example, on the grounds of ethnicity, age, sex, or disability.
But how to detect and measure bias?
The first step is to check the quality of your data, which is one of the most common ways for bias to sneak into the data set. But even if there are no flaws in your data, the model can still be biased.
You can usually only detect bias as an effect on the result of the model. You do this with a so-called Fairness Metric, which is the topic of the next section. As you can see, the attempt to avoid defining fairness by looking at bias instead, did not get very far.
Fairness metrics Click to read
Since there is no single, perfect definition of fairness, there is not one single right metric to measure fairness, and a one-size-fits all solution is impossible. Instead, there are many different types of fairness and ways to measure it, including group fairness, conditional statistical parity, false positive error rate balance, false negative error rate balance, conditional use accuracy equality, overall accuracy equality, test-fairness, well-calibration, fairness through unawareness, counterfactual fairness and many more.
Unfortunately, you cannot simply test all of them to ensure that your algorithm is fair, since these metrics are likely to lead to contradictory results. For instance, it is mathematically impossible to fulfil the requirements for both predictive parity and equalized odds. Consider the following formula, derived in [18]:
FPR = (1 – FNR)
p .1 - PPV
1-p PPV
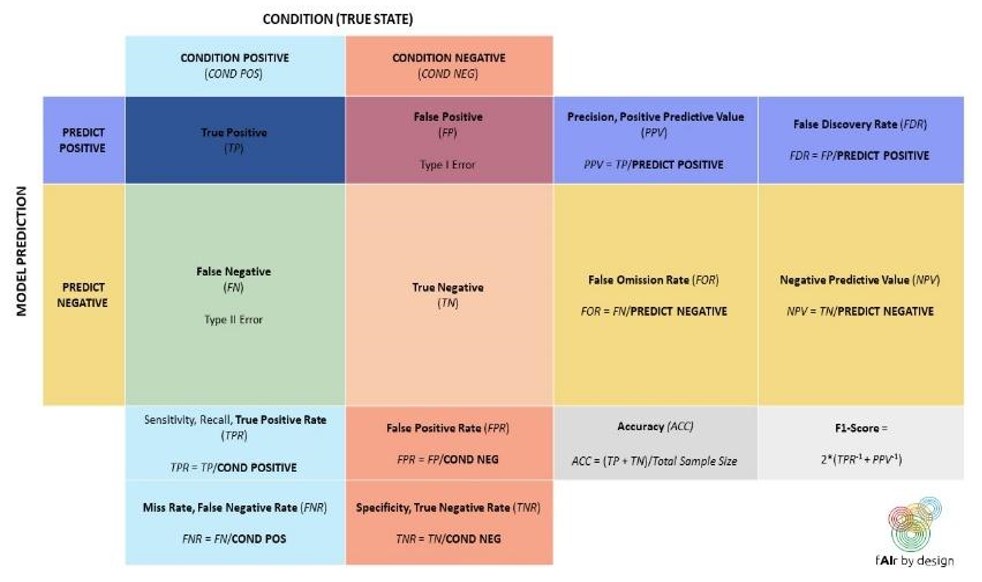
The p in the formula refers to the prevalence of the POSITIVE class, and you can use the confusion matrix below to understand the other terms. Now suppose that you have two demographic groups, G1 and G2, with prevalence p1 and p2. If equalized odds holds, then FPR and FNR are the same for both groups. If predictive parity holds, then also PPV is the same for both groups. Plugging all this information into the formula above, you will end up with two equations, one for G1, and one for G2. A little bit of algebra will then show you that p1 and p2 must also be equal.
To summarize: if both equalized odds and predictive parity are true, then the prevalence must be the same for both groups. Conversely, if the prevalence is not the same for both groups, then equalized odds and predictive parity cannot both hold true!
The mathematical impossibility of satisfying all fairness metrics simultaneously means that a decision needs to be made regarding which definition of fairness should be applied. Unfortunately, there is currently no legal framework, or best practice examples – and this means that you need to consider the context of your AI application carefully before choosing the metric for evaluating its impact in terms of fairness.
To understand the implications of having multiple definitions of fairness that are not compatible, and the importance of agreeing on a definition before such systems are deployed, we will take a look at a real-life example that triggered much of the research and debate on bias in algorithms in the data science and ML community.
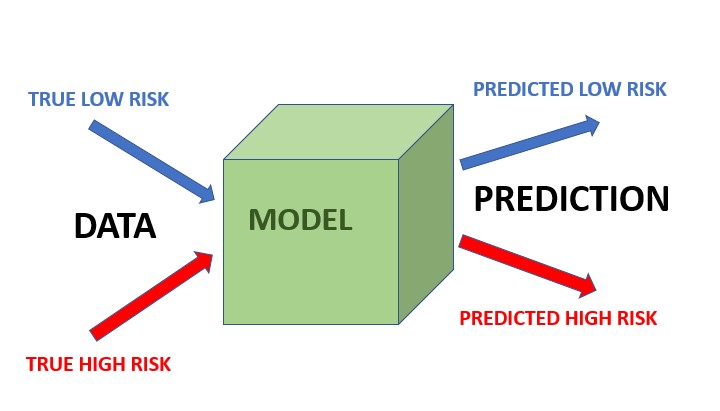
COMPAS is an AI system developed by a company called Northpointe, and is used in the United States criminal justice system in order to estimate a defendant’s risk for recidivism (in other words, to rate a defendant’s risk of committing another crime in the future). This risk score is then used to make decisions about parole, or early release.
To produce its outputs, the AI system drew on historical crime records, which tracked past criminal offenders and whether they were re-arrested for another crime after release - i.e., it contained information about whether certain types of defendants were likely to commit crimes again (and get caught doing so!). These records were used to train the model to predict the recidivism risk of defendants who were not part of the dataset, once the system went live. This means that the likelihood of recidivism for each defendant was calculated and defendants were then classified as low-risk or high-risk.
In May 2016, ProPublica published an article indicating that the predictions of this recidivism modelling model were biased [18; see also 19, 20]: ProPublica demonstrated that the AI system’s formula was particularly likely to falsely flag Black defendants as high risk for recidivism, wrongly labeling them this way at almost twice the rate as White defendants (42% vs. 22%); at the same time, White defendants were mislabeled as low risk more often than Black defendants.
If we look at the confusion matrix above, we can see that ProPublica was saying that COMPAS was unfair because FPR and FNR were not the same for Black defendants vs. White defendants. It turns out, this is the Equalized Odds fairness metric:
- Equalized odds
Equalized odds means that within each true risk category, the percentage of false negative predictions and false positive predictions is equal for each demographic. The question is no longer focused on the model’s overall accuracy, but rather breaks down the types of error the model can make (false positives and false negatives), and requires that the model errors are comparable: FPR is equal across groups, and FNR is equal across groups.
Northpointe defended their system COMPAS against the accusation of bias, by pointing out that, if a defendant was predicted to be high risk by the model, then the chance that they would actually re-offend was the same, regardless of which demographic group the defendant belonged to. Northpointe is saying: the probability of a true positive, given that the model predicted positive, is the same for all groups. This is known as the Predictive Parity fairness metric.
- Predictive parity
Predictive parity means that the proportion of correctly predicted high risk defendants is the same regardless of demographic. In other words, predictive parity refers to the concept in ML and AI that the predictive models used should produce the same Positive Predictive Value (PPV) for different groups, regardless of their membership in a protected class (e.g., race, gender, age, etc.). PPV is a metric used to evaluate the proportion of true positive predictions (correctly classified positive instances) among all instances in which the model predicted positive. However, such a metric does not account for the overall prevalence of instances within a dataset!
To rephrase, Predictive Parity considers fairness by looking at errors relative to the predicted class, whereas Equalized Odds looks at errors relative to the true class. Whether it is more important to optimize PPV (and hence, you would prefer the predictive parity fairness), or whether you prefer to minimize FPR (and thus prefer equalized odds) is very much a matter of perspective. For example, which error metric is more important to you if you have received a medical diagnosis from an AI system? And which error metric is more important in a hiring algorithm used to hire for a job you have applied for? Can you think of situations where you might consider PPV more important, and other situations where you would prefer a low FPR?
If you want to learn more about the different definitions of fairness (actually, there are currently more than 21), how to measure them, and the differences between them, check out „Fairness Definitions Explained” [22].
Reflect: Returning to the COMPAS example, which definition would you call fair?
Explain: Is it possible to satisfy both definitions of fair?
Answer: We need to understand the prevalence of recidivism. In the USA, the overall recidivism rate for black defendants is higher than for white defendants (52% vs. 39%). According to the formula we saw above, this means that it is not possible for both definitions of fairness to hold true.
This COMPAS case exemplifies how social issues have an impact on the data that is available in the first place. Overpolicing of Black communities means that the likelihood of arrests made or incidents recorded is higher for these communities. As a result, biased data is fed into the models. And even more subtle – this means that the perceived recidivism rate for the two populations is not the same, forcing very difficult decisions about which fairness metric to use – i.e. what is even fair in this context.
The actual problem is that there are systemic biases in the judicial and enforcement system (in the USA, but also elsewhere!), which cannot simply be fixed by feeding more data (historic cases) into the system. An excellent discussion of the problems with using bad data to drive predictions in policing can be found in “Dirty Data, Bad Predictions: How Civil Rights Violations Impact Police Data, Predictive Policing Systems, and Justice” [22].
Systemic biases also affect other areas of application, whether they concern health, education, or how much you pay for products or services. Sometimes, we can choose the right tools to account for such systemic biases. And sometimes, we need to admit that the conditions are not right for a safe use of algorithms. Such choices, however, should not be left to the data scientist alone, but should involve a multitude of stakeholders and many different expertises – including for example, sociology, psychology, law, and context-specific domain experts.
AI and data science cannot do miracles and solve our societal problems, but we can use the technology as a tool to bring these systemic problems to light and address them as a society as a whole.
Because “AI only works, if it works for us all”[24].
Conclusion
Conclusion Click to read
So let’s sum up, what we have learned:
On the one hand, data science and AI have a huge variety of applications with positive social impact. For example, data science is useful to investigate how social media impacts human rights. On the other hand, data science and AI applications also carry risks to health, safety, the environment and human rights. Bias and discrimination, privacy concerns, and harmful environmental impacts are just some of the possible effects. Fairness of outcomes in data science and AI applications can be measured in many different ways. Building trustworthy AI applications requires intensive interdisciplinary collaboration: by making sure that our development processes are inclusive and allow for broad participation, we can build better applications.
|
 Play Audio