DataScience Training


Correspondence Analysis, AC
Feedback form    |       Play Audio    |   Download:    |   


Correspondence Analysis

Introduction

Correspondence Analysis, CA Click to read  

Correspondence analysis is a statistical method for the analysis of multidimensional data, it is a multivariate technique that analyzes patterns of association between qualitative variables.


Qualitative variables are variables that are not represented by numbers, but by modalities, for example: gender, level of education, marital status, etc.

Since qualitative variables are used in the AC, the object of the analysis are the contingency matrices, whose elements indicate the number of times (the counts) that the characteristics of two different quantities have been detected together.


Goal of Correspondence Analysis Click to read  

The main goal of AC is to analyze the relationships between a set of qualitative variables observed on a collective of statistical units. This is done through the identification of an "optimal" space, i.e. a small dimension that represents the synthesis of the structural information contained in the original data.

In essence, they will build a series of latent variables (or factors), a combination of the original variables, which express some concepts not directly observable in reality, but the result of the measurement of a set of variables.


The assumption in Correspondence Analysis Click to read  

In Correspondence Analysis, the variables used do not have to be independent, so the modes of one variable must influence the modes of the other.

Before carrying out a correspondence analysis it is necessary to establish the degree of interdependence between the characters considered because, if they are independent, it may not make sense to search for the correspondences between them.
For this purpose, it is necessary to apply the Chi-square test, which assesses any interdependence relationships between the qualitative variables.

The test starts of the null hypothesis that considers the two independent variables. The alternative hypothesis will be that the two variables have a certain degree of interdependence.
If the test results return a p-value < 0.05, the null hypothesis can be rejected and consequently the two variables will be considered interdependent, and you can continue with the analysis.

Correspondence Analysis

Contingency Tables Click to read  

The contingency tables contain the joint frequencies of the variable modes. Given two qualitative variables X and Y, the relevant contingency table will contain how many times a given mode of variable X occurs with a given mode of variable Y.


The Correspondence Analysis allows to represent the phenomenon both in the space of the rows and in the space of the columns.
To do this, the row and column profile matrices must be constructed:
- dividing the absolute frequencies by the corresponding marginal rows (or column);
- dividing the relative frequencies (i.e. the absolute frequencies divided by the total number of the sample) by the respective row (or column) margins.

Row Profile Matrix

Column Profile Matrix


Distances Between Profiles Click to read  

Finally, you have to calculate the distances between the profiles to see if the modalities are similar or not, distant or not, i.e. see if the profiles resemble each other or not.
There are two types of distances: the Euclidean distance and the Chi-square distance.

-Euclidean distance favours higher distances than lower ones and is calculated by making the difference between the relative frequencies and then squaring them.
- The distance of the Chi-square favours the lowest distances as it takes into account the number with respect to the rows. It is calculated by weighting the difference in frequencies relative to the frame by the inverse of the marginal of row (or column).
 
A Case Study

Import the Dataset Click to read  
Chi-square Test Click to read  

The Chi-quadro test is necessary to verify that the variables, are not independent (in this case the Italian regions and the crimes committed in Italy)
The null hypothesis of the test will be: ''Variables are Independent''


One of the criteria for rejecting or not rejecting the null hypothesis is to observe the p-value.
Given an alpha= 5%, the p-value: 2.2e-16.
Since the p-value is less than 5%, i.e. 0.05, the null hypothesis is rejected, so the two variables are considered with a certain degree of dependence.


Correspondence Analysis on R Click to read  

For the AC, R provides a package called FactoMineR.
First you need to install the FactoMineR package.


Given the objective of the AC, observing the inertia explained, we can see how much size the phenomenon is reduced to.
We see that the first dimension alone explains about 60% of the overall variability of the data.


Joint two-dimensional graph individual-variables graphically represents how the modes of the two variables are arranged along the axes created by the newly extracted dimensions.


Keywords

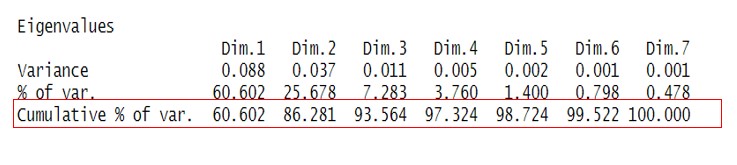
Keywords (meta tags) AC, qualitative variables, explained inertia, eigenvalues

Objectives/goals:

The aim of this module is to introduce and explain the Principal Component Analysis technique.


At the end of this module you will be able to:


- Know the logic of AC


- Know the requirements


- Conduct an AC 


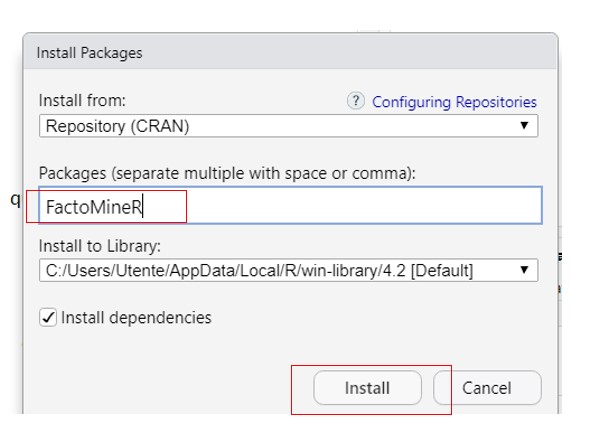
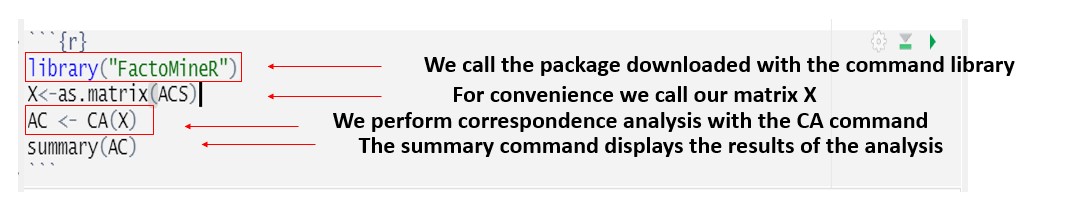
- Conduct an AC in R with the FactoMineR package


Description:

In this training module you will be presented the multidimensional analysis technique called Correspondence Analysis, AC.

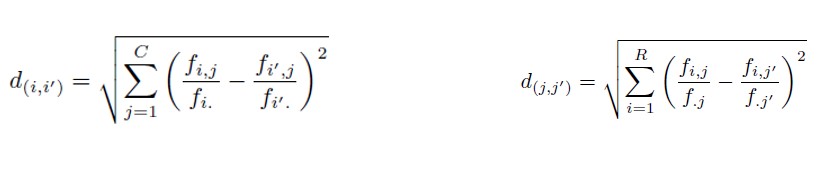
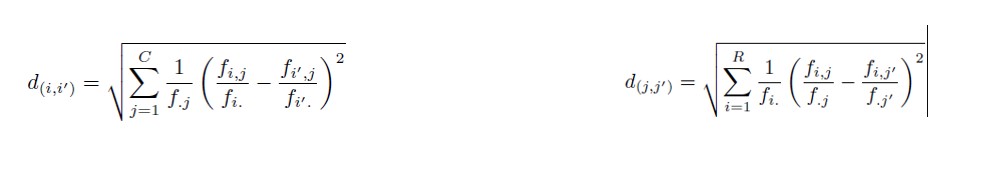
Correspondence Analysis is a form of multidimensional scaling, which essentially builds a kind of spatial model that shows the associations between a set of categorical variables. If the set includes only two variables, the method is usually called Simple Correspondence Analysis (SCA). If the analysis involves more than two variables, then it is usually called Multiple Correspondence Analysis (MCA). In this module we will deal with the analysis of simple correspondences, the objective of this analysis is to reduce  the dimensionality of the phenomenon under investigation while preserving the information contained by it. The technique is applicable to phenomena measured with  qualitative variables.

The last part of the module will be dedicated to the application of AC with the R software.

Bibliography

Van der Heijden, P. G. M. & de Leeuw, J. (1985). Correspondence analysis used complementary to loglinear analysis, Psychometrika, 50, pp. 429-447.

Le, S., Josse, J. & Husson, F. (2008). FactoMineR: An R Package for Multivariate Analysis. Journal of Statistical Software. 25(1). pp. 1-18.

Mineo, A. M. (2003). Una Guida all'utilizzo dell'Ambiente

Statistico R, http://cran.r-project.org/doc/contrib/Mineo-dispensaR.pdf.


Related training material

Partners

Università del Salento
Demostene Centro Studi
IHF
IWS
Universidad de Oviedo
ASE
WAI