DataScience Training


Cluster Analysis
Feedback form    |       Play Audio    |   Download:    |   


Cluster analysis

Introduction

Cluster Analysis Click to read  

Cluster analysis is a type of multivariate analysis technique that can be applied in many fields: from computer science, medicine and biology, from archaeology to marketing, whenever it is necessary to classify a large amount of information into distinguishable groups.

Goal Click to read  

Cluster analysis is used to group statistical units (records) that have common characteristics and assign them to categories not defined a priori.
The groups (clusters) formed must be as homogeneous as possible inside (or even similar, intra-cluster) and heterogeneous outside (or even dissimilar, inter-cluster).


Type of Variables Click to read  

In Cluster Analysis you can use:

-quantitative variables, therefore numeric;

-qualitative variables, which present modalities (e.g. gender, level of education, marital status, etc.)

Cluster Analysis

Dissimilarity Matrix (or Distance Matrix) Click to read  

The distance matrix D is useful to know how many statistical units are different from each other, it is decisive for the choice of variables to be considered.
The distance matrix, of dimensions 
n×n , is a symmetric matrix that has on the greater diagonal all 0, this is because the distance between a point and itself is zero.

Before creating the distance matrix, the starting matrix must be standardized, so each variable will have the same weight as the others.

To obtain the distance matrix D it is necessary to calculate the distances between the points.
Depending on the type of variable, quantitative or qualitative, with which you are working, these distances can be calculated in different way

Quantitative variables:

- Euclidean distance, sensitive to outliers.
-Manhattan distance, very robust.                                                                                                                                                                                          
                                                                                                                                                 

Qualitative variables:

The frequencies are taken into account, the similarity matrix is created and the concordances and discrepancies between the choices are calculated.

Two types of similarity indices:

-Zubin, for symmetric binary variables.
Jaccard, for asymmetric binary variables. 


Creating cluster Click to read  

Thanks to the link rule we can choose the type of link that we will use to form clusters, among the following:

-Simple linkage
-Complete linkage
-Average linkage
 

Simple linkage:

The groups are put together according to the minimum distance between the observations, this link favors the homogeneity of the elements of each group to the detriment of differentiation.


Complete linkage:  

The groups are put together according to the minimum maximum distance between the points, so first the greatest distances between the groups are calculated and then those that have the least distance are chosen. This type of link highlights differences between groups rather than internal homogeneity.

Average linkage:  

The groups are put together according to the minimum average distance, i.e. first calculate the average distance between all the observations and then between them we take the minimum distance. This type of link is less sensitive to extreme values, so it will be more robust.


Fusion Distance and Dendogram Click to read  

After choosing the most appropriate link for your analysis and the creation of groups, you can create the graphic representation: the Dendogram.
It is represented according to increasing ordinates the level of aggregation of the clusters. On the x-axis there are points, on the y-axis there are distances


The distance between clusters tends to increase and for this reason we choose a stop rule that allows us to choose the number of groups we want to get.

To do this we use the tree cutting technique:

-Looking at the longest branches;
-Through the criterion of parsimony (usually 4-5 homogeneous clusters inside and heterogeneous outside);
With the fusion distances  Scree-plot (when the graph flattens, or if in the transition from g to g+1 groups there is a strong increase);
-Taking care that there are no outliers (clusters composed of a single point).


Case Study on R

Creating the Distance Matrix Click to read  

After importing the dataset into R, we start with the analysis in Cluster:


Choosing the Type of Link Click to read  

The result obtained with the Simple linkage:


The same procedure is carried out for the complete linkage and the average linkage.
You will compare the results and choose the most representative link for the analysis you are conducting.

Comparing the three links, the most suitable is the complete likage as it divides the clusters better, avoiding that there is too much internal homogeneity at the expense of external heterogeneity. It also prevents the formation of outliers, i.e. clusters composed of a single point.


Keywords

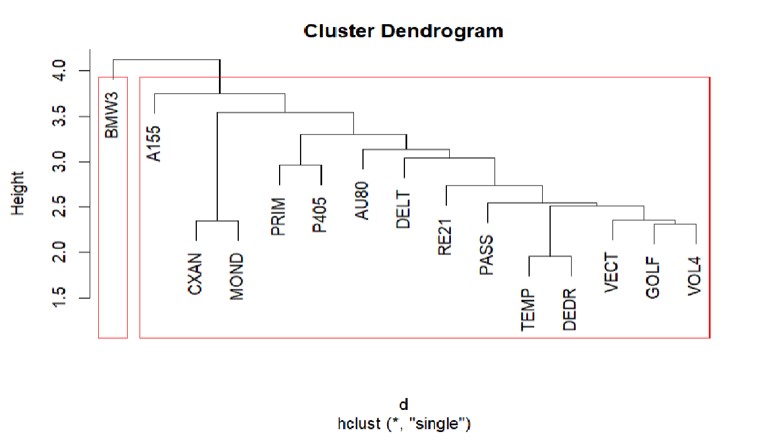
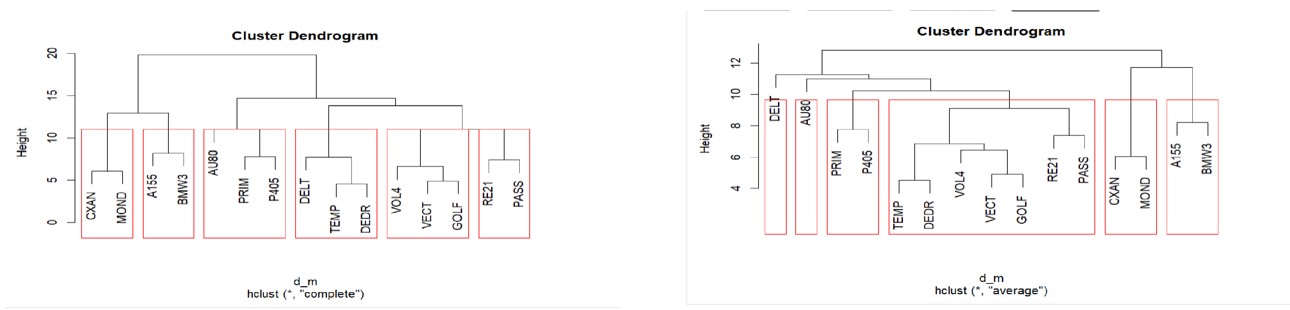
Statistical units, cluster, intra-cluster, inter-cluster, dissimilarity index, merge distance, dendogram.

Objectives/goals:

The aim of this module is to introduce and explain the technique of Cluster Analysis.


At the end of this module you will be able to:


  • Know the logic of Cluster Analysis

  • Know the requirements


Conduct a Cluster Analysis


Description:

In this training module you will be presented the multidimensional analysis technique called Cluster Analysis, also called automatic group analysis.

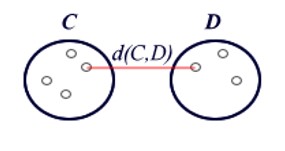
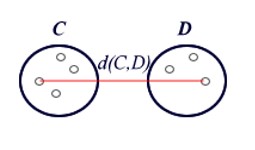
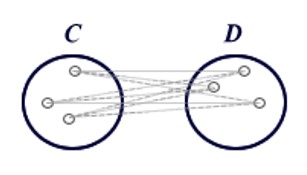
Cluster analyses are used to group statistical units that have characteristics in common and assign them to categories not defined a priori. The groups that are formed must be as homogeneous as possible inside (intra-cluster) and heterogeneous outside (inter-cluster).

The application of this type of analysis is manifold: computer science, medicine, biology, marketing.

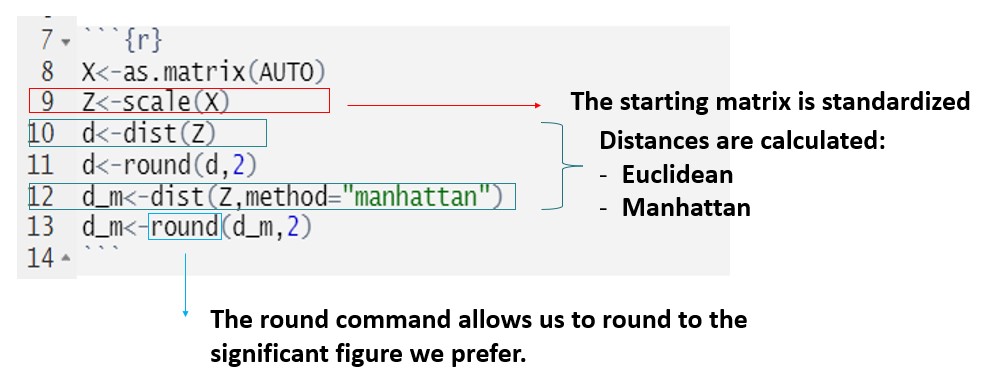
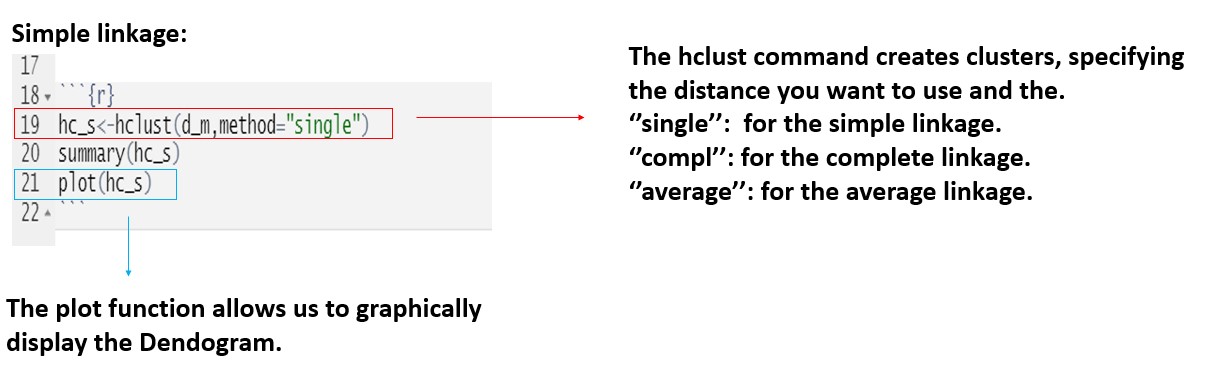
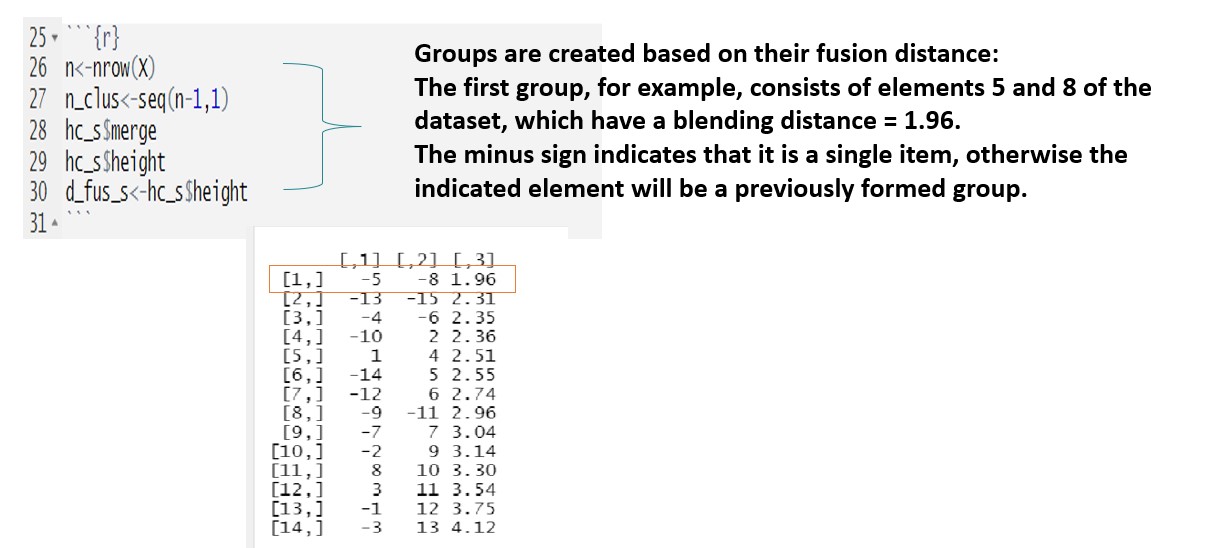
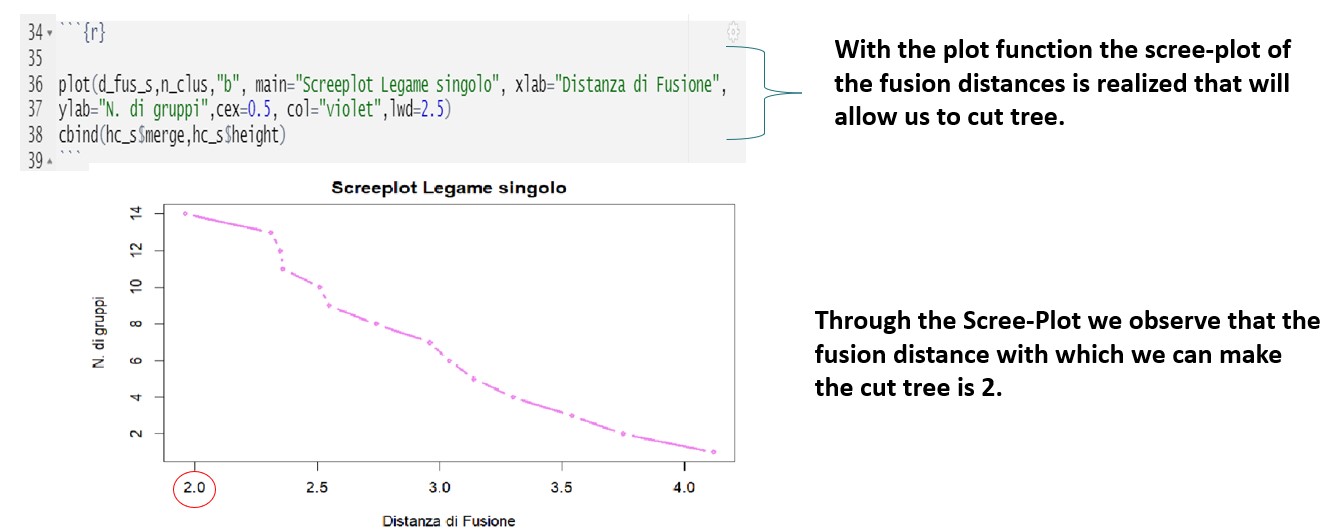
The last part of the module will be dedicated to the application of cluster analysis with the R software.


Related training material

Partners

Università del Salento
Demostene Centro Studi
IHF
IWS
Universidad de Oviedo
ASE
WAI